

DEEP DIVE | Net Zero design
QUANTIFYING DESIGN-LED CIRCULARITY
CHALLENGE
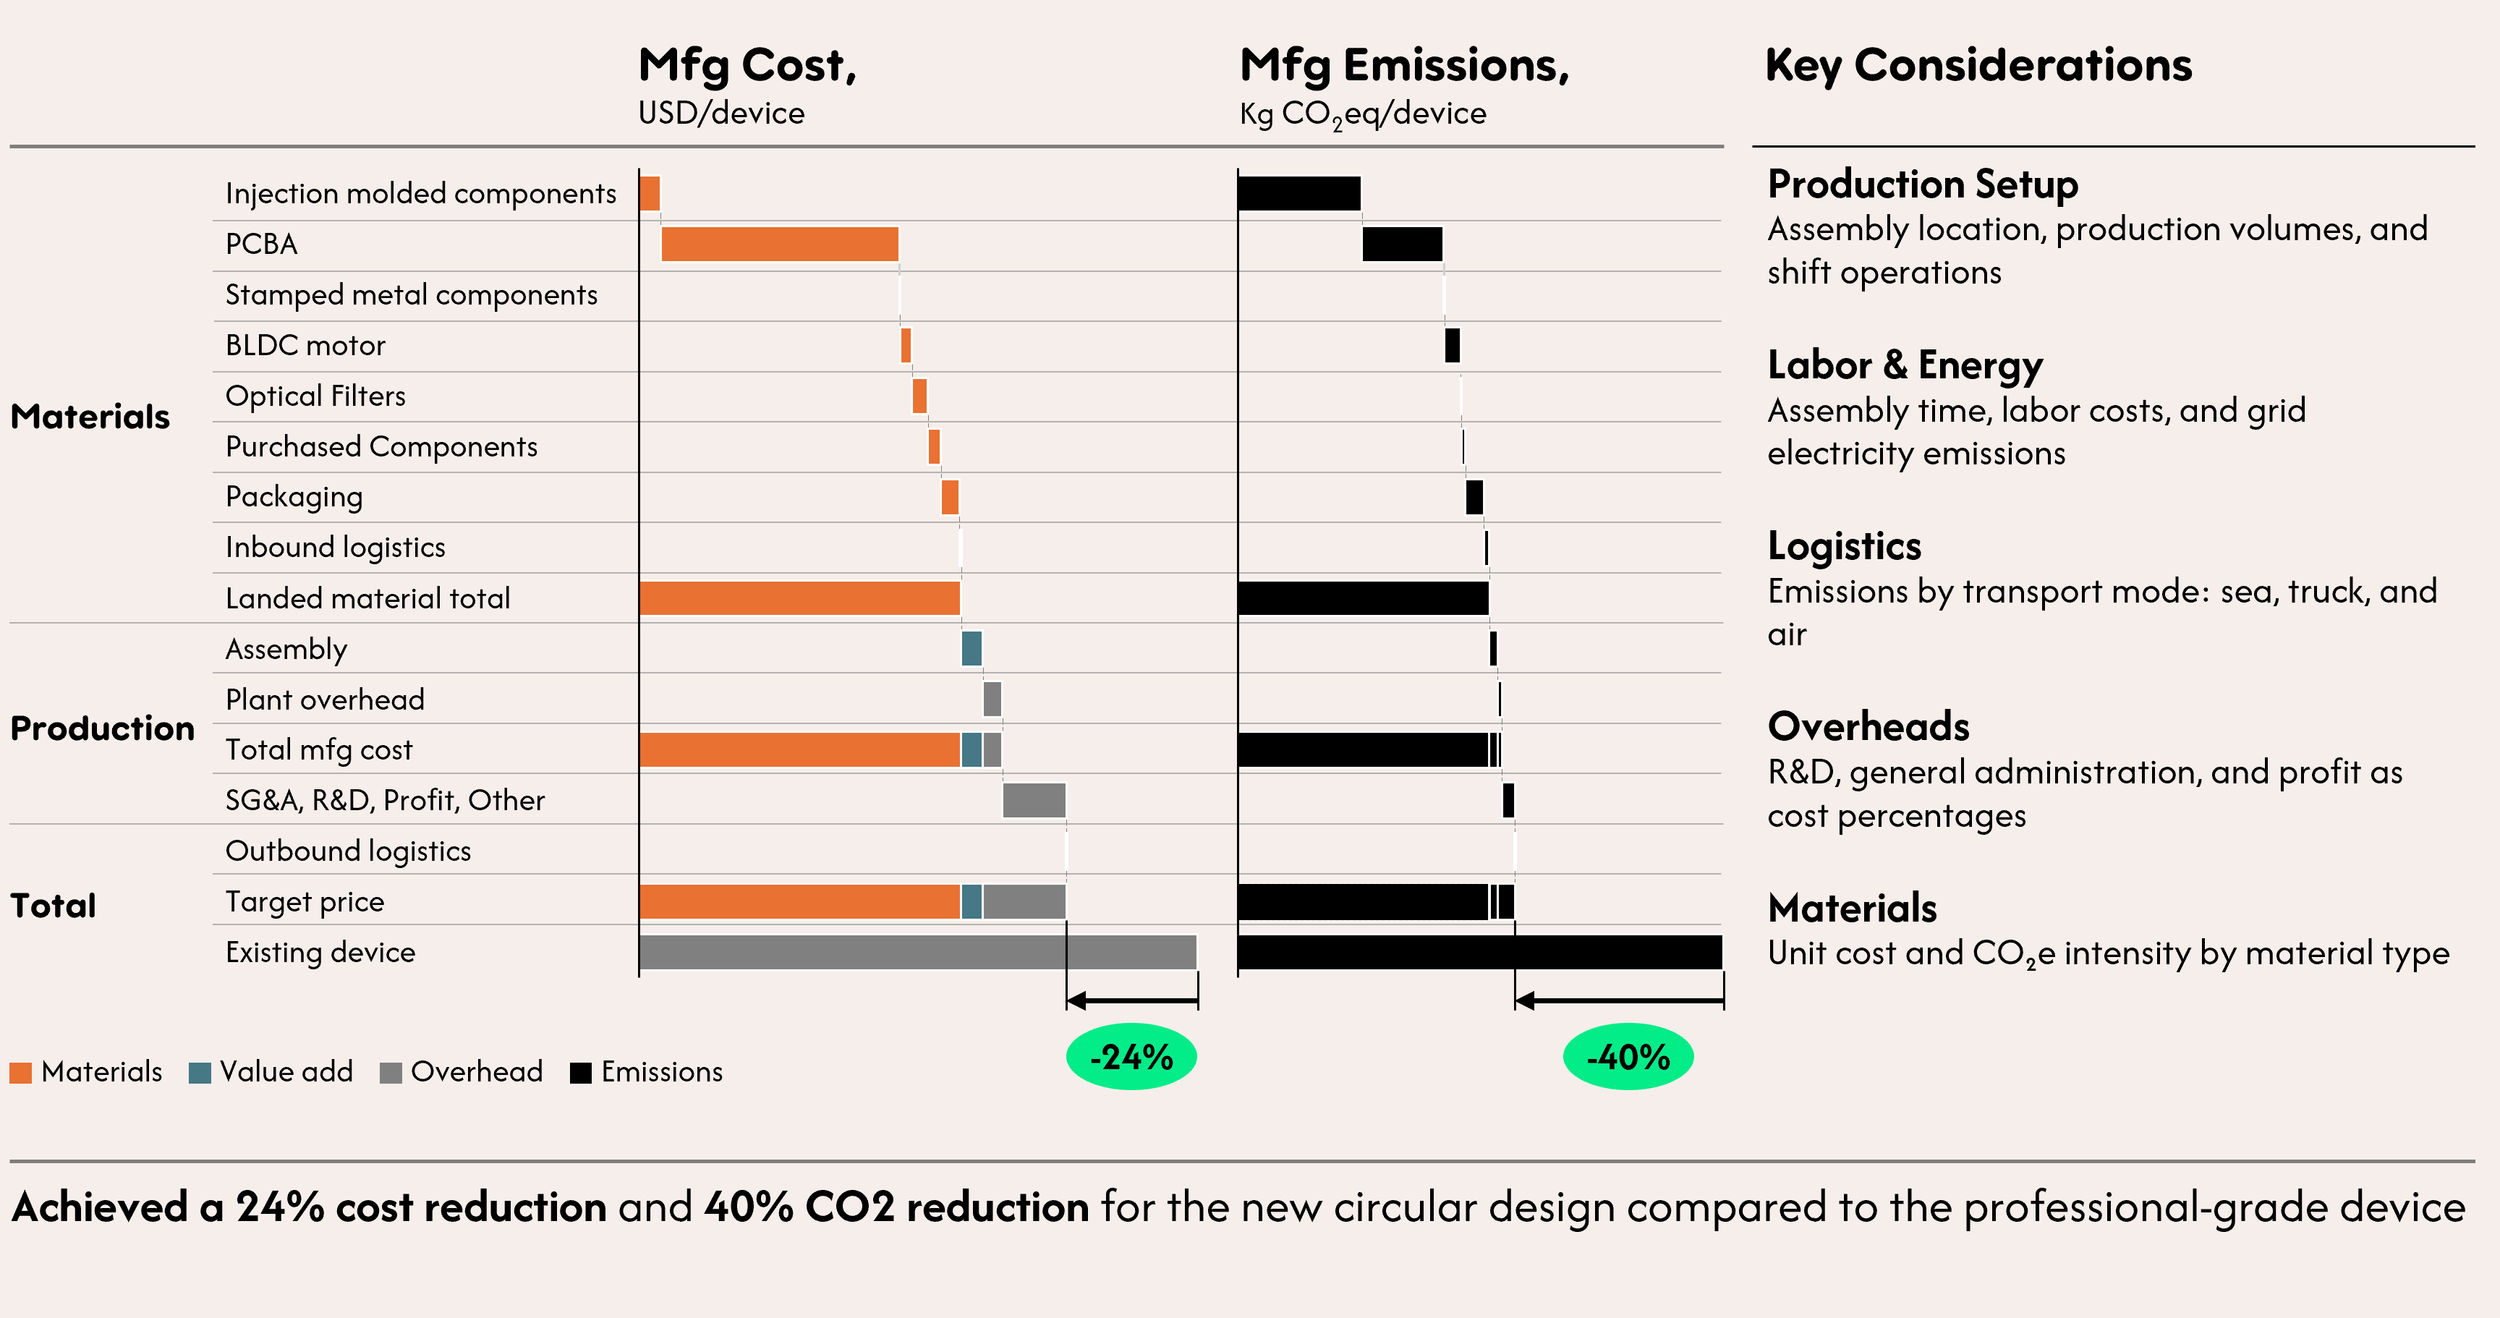
Uncovering cost and emission hotspots
The impact of the new design was unclear. Benchmarking against the professional-grade device helped identify key cost and emission hotspots—revealing opportunities for optimization.
IDENTIFYING IMPACT LEVERS
A comparative Life Cycle Assessment (LCA) and should-cost analysis over eight weeks quantified the environmental and financial impact of both designs.
Teardown data, the Bill of Materials (BOM), and ecoinvent inputs established a baseline—pinpointing key levers to reduce emissions and cost through circular design.
WHY NET ZERO STARTS AT DESIGN
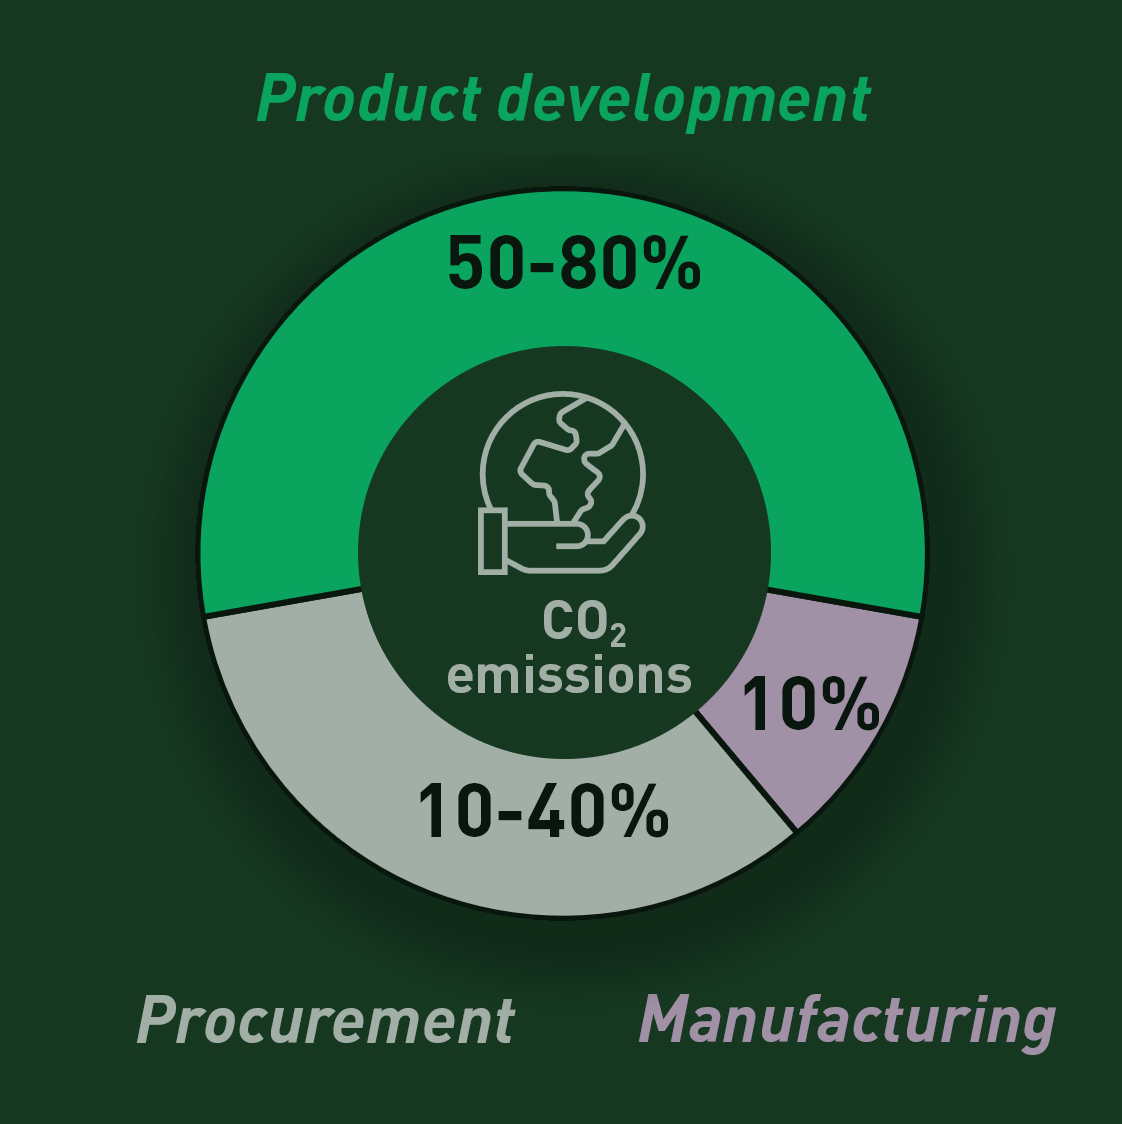
Up to 80% of a product’s footprint is locked in at the design phase—yet every product eventually becomes waste. Designing for sustainability from the start isn’t just responsible; it’s a strategic advantage. A Net Zero strategy reduces emissions, transforms business models, strengthens consumer relationships, and drives lasting impact.
PATH TO NET ZERO
Let’s break it down into these 4 steps
To chart a path to Net Zero, I developed a clear approach: Measure, optimize, reduce, and offset—cutting carbon at the source and managing what remains.
01
MEASURE
the entire product lifecycle with Life Cycle Assessment (LCA) to benchmark impact
Addressing Scope 3 emissions is crucial they typically make up the largest share of a company’s carbon footprint
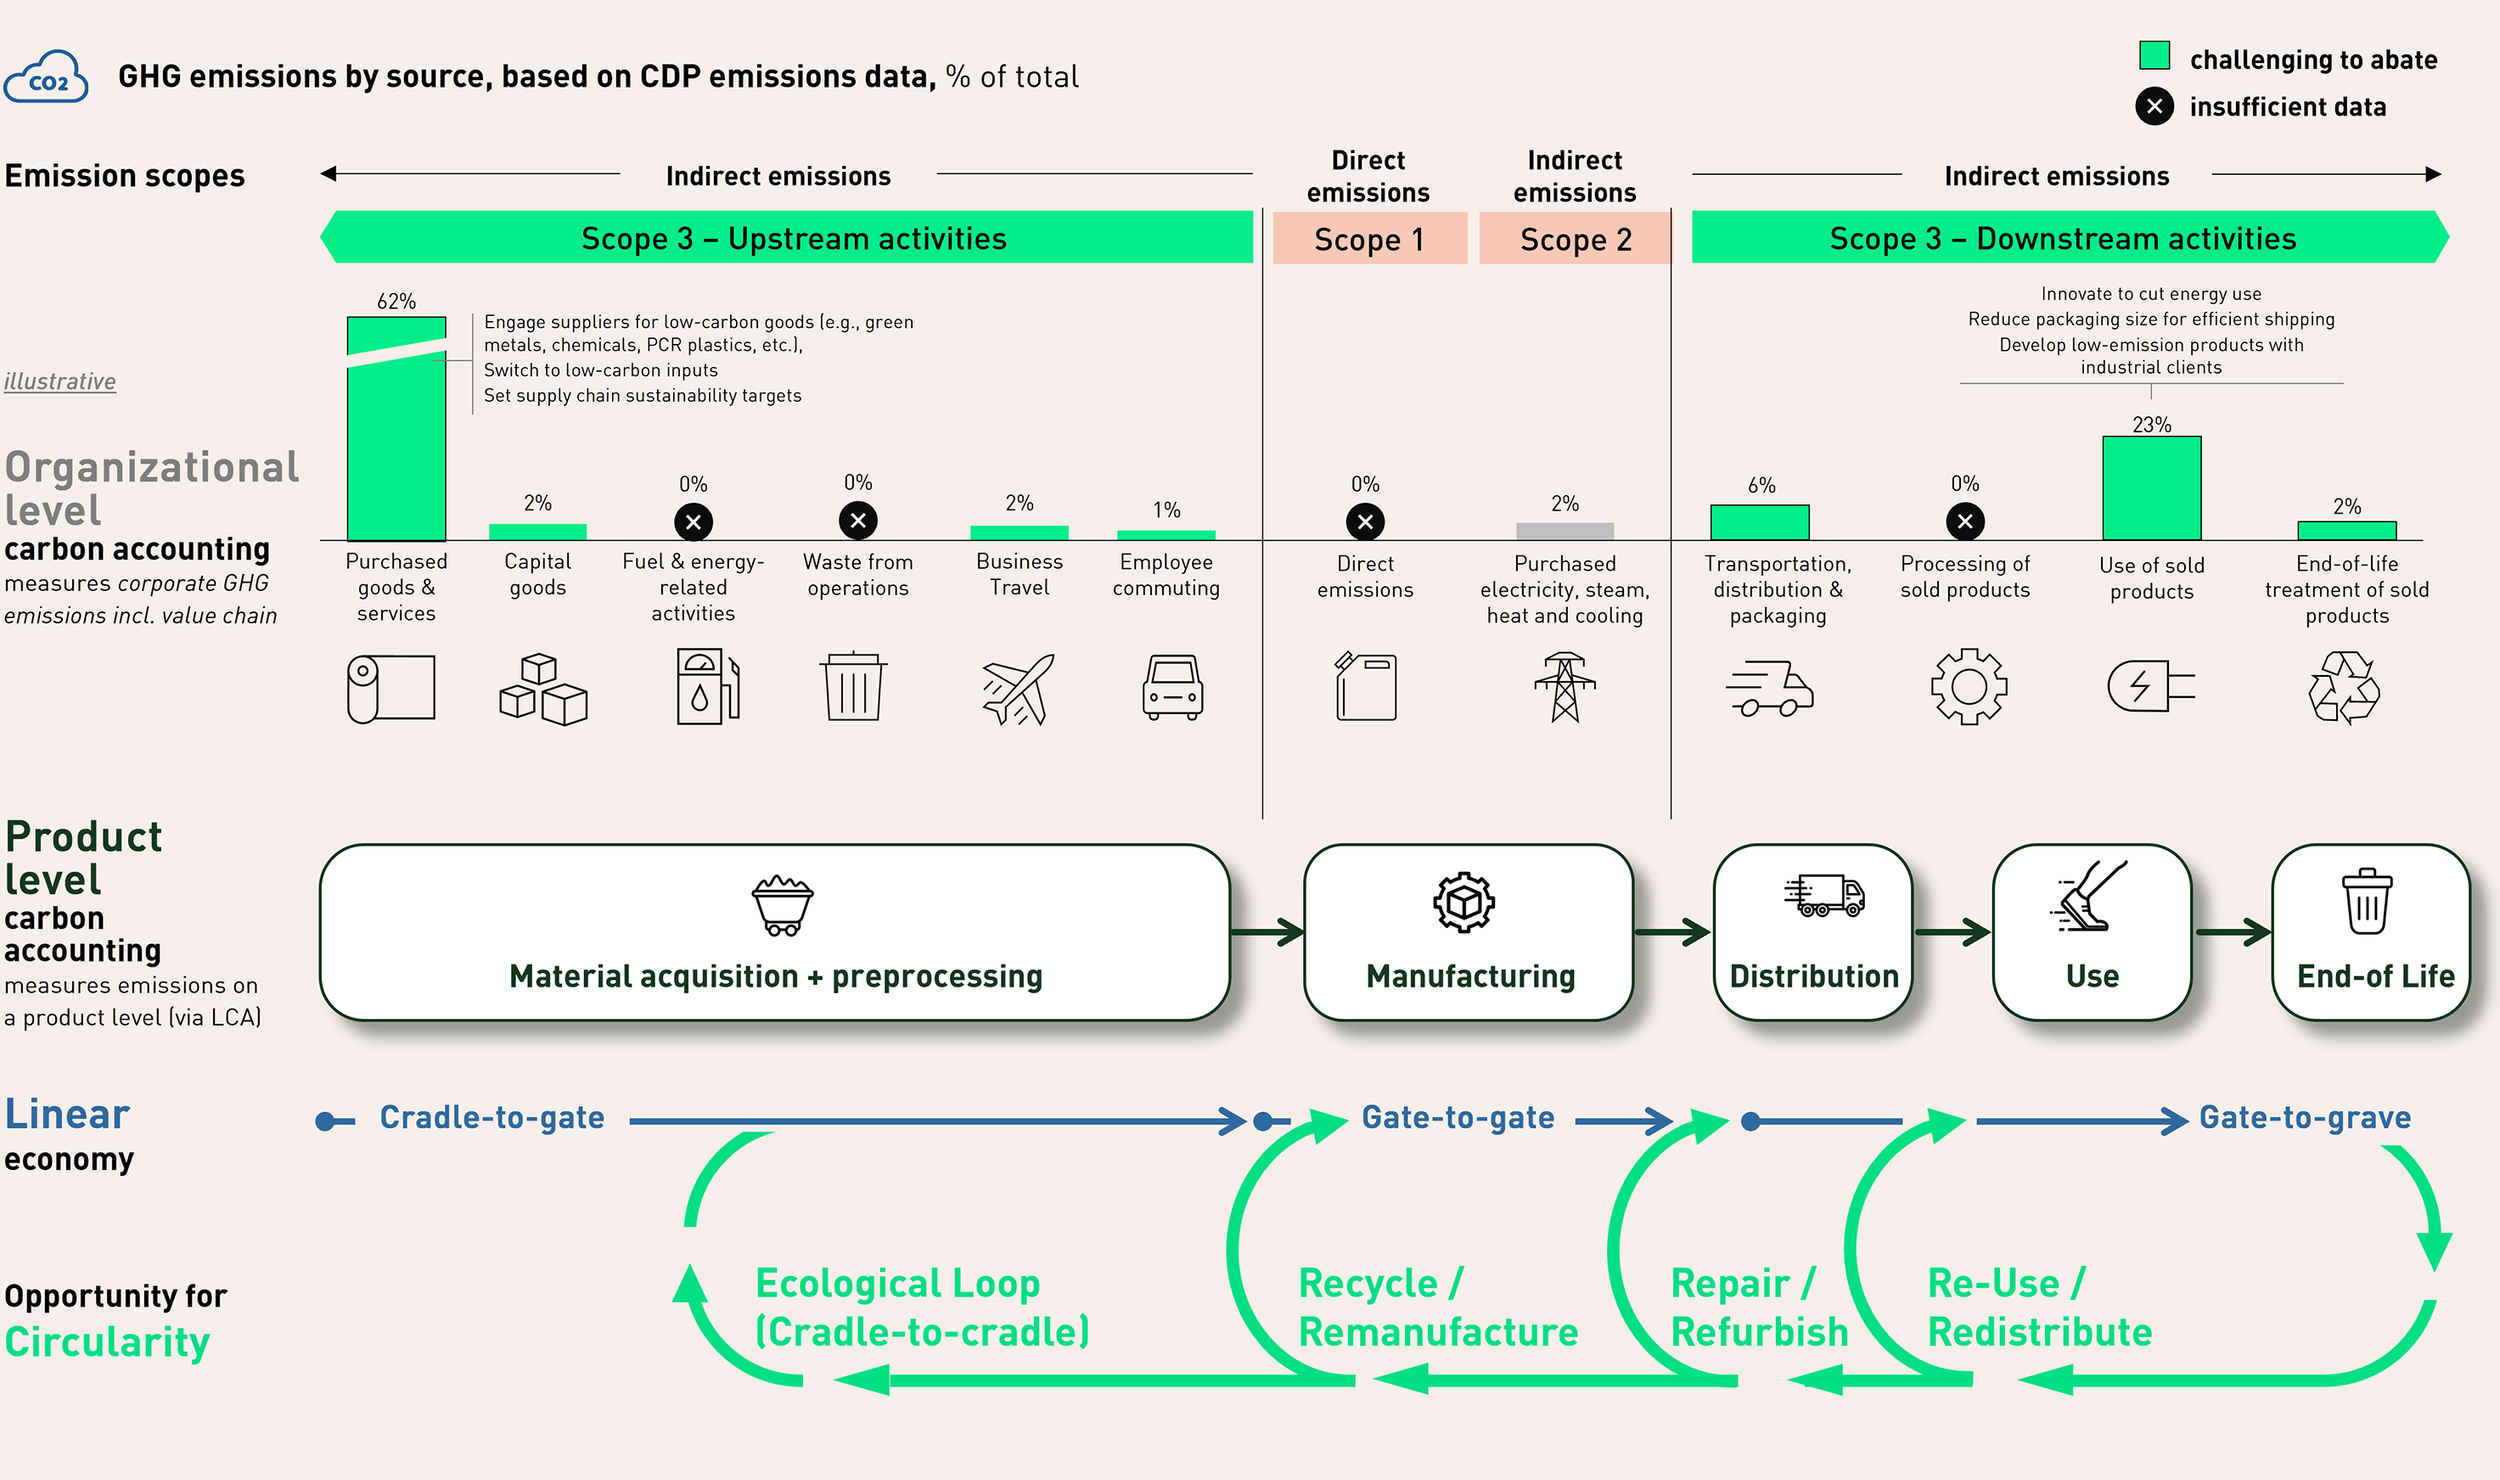
‘Materials’ and ‘Use’ phase drive most emissions. Improving material efficiency, reducing energy use, optimizing packaging, and nearshoring can cut the largest share of a product’s footprint.
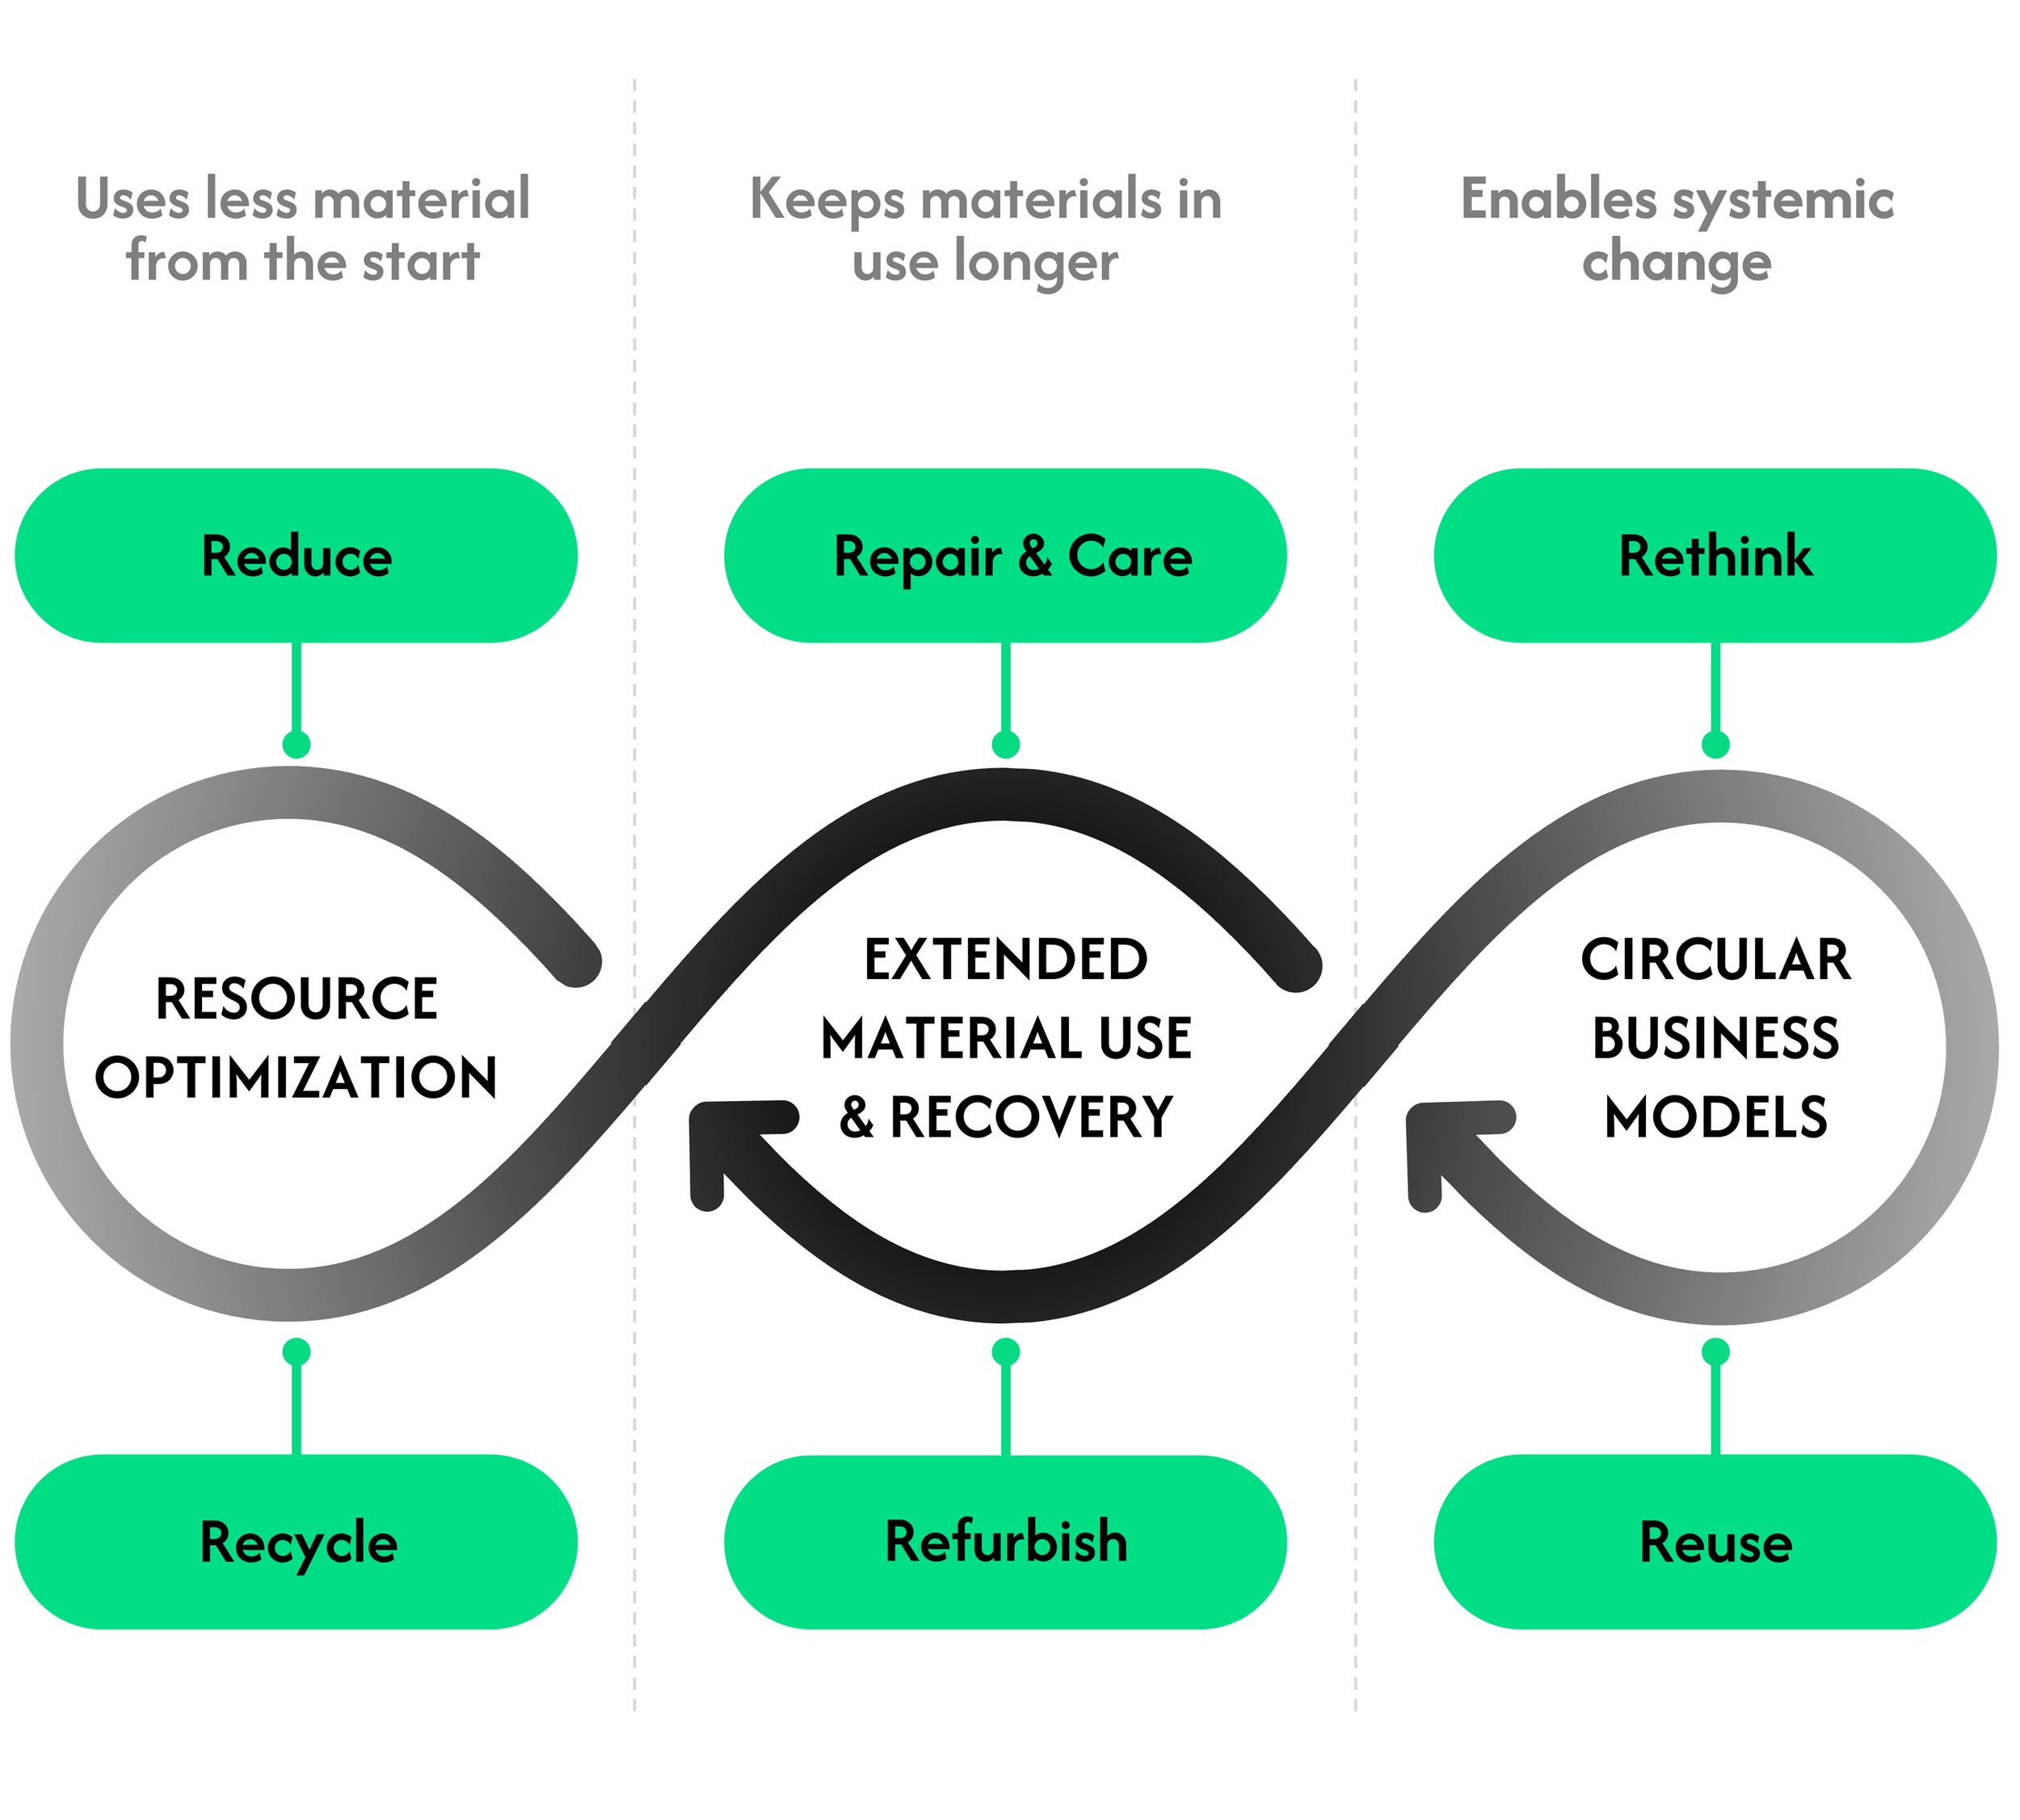
OPTIMIZE
with circular design principles to close material loops, extend product life, and enable cost-effective sustainability
02
The 6 Rs of circular innovation drive material efficiency, extend product life, and reshape business models
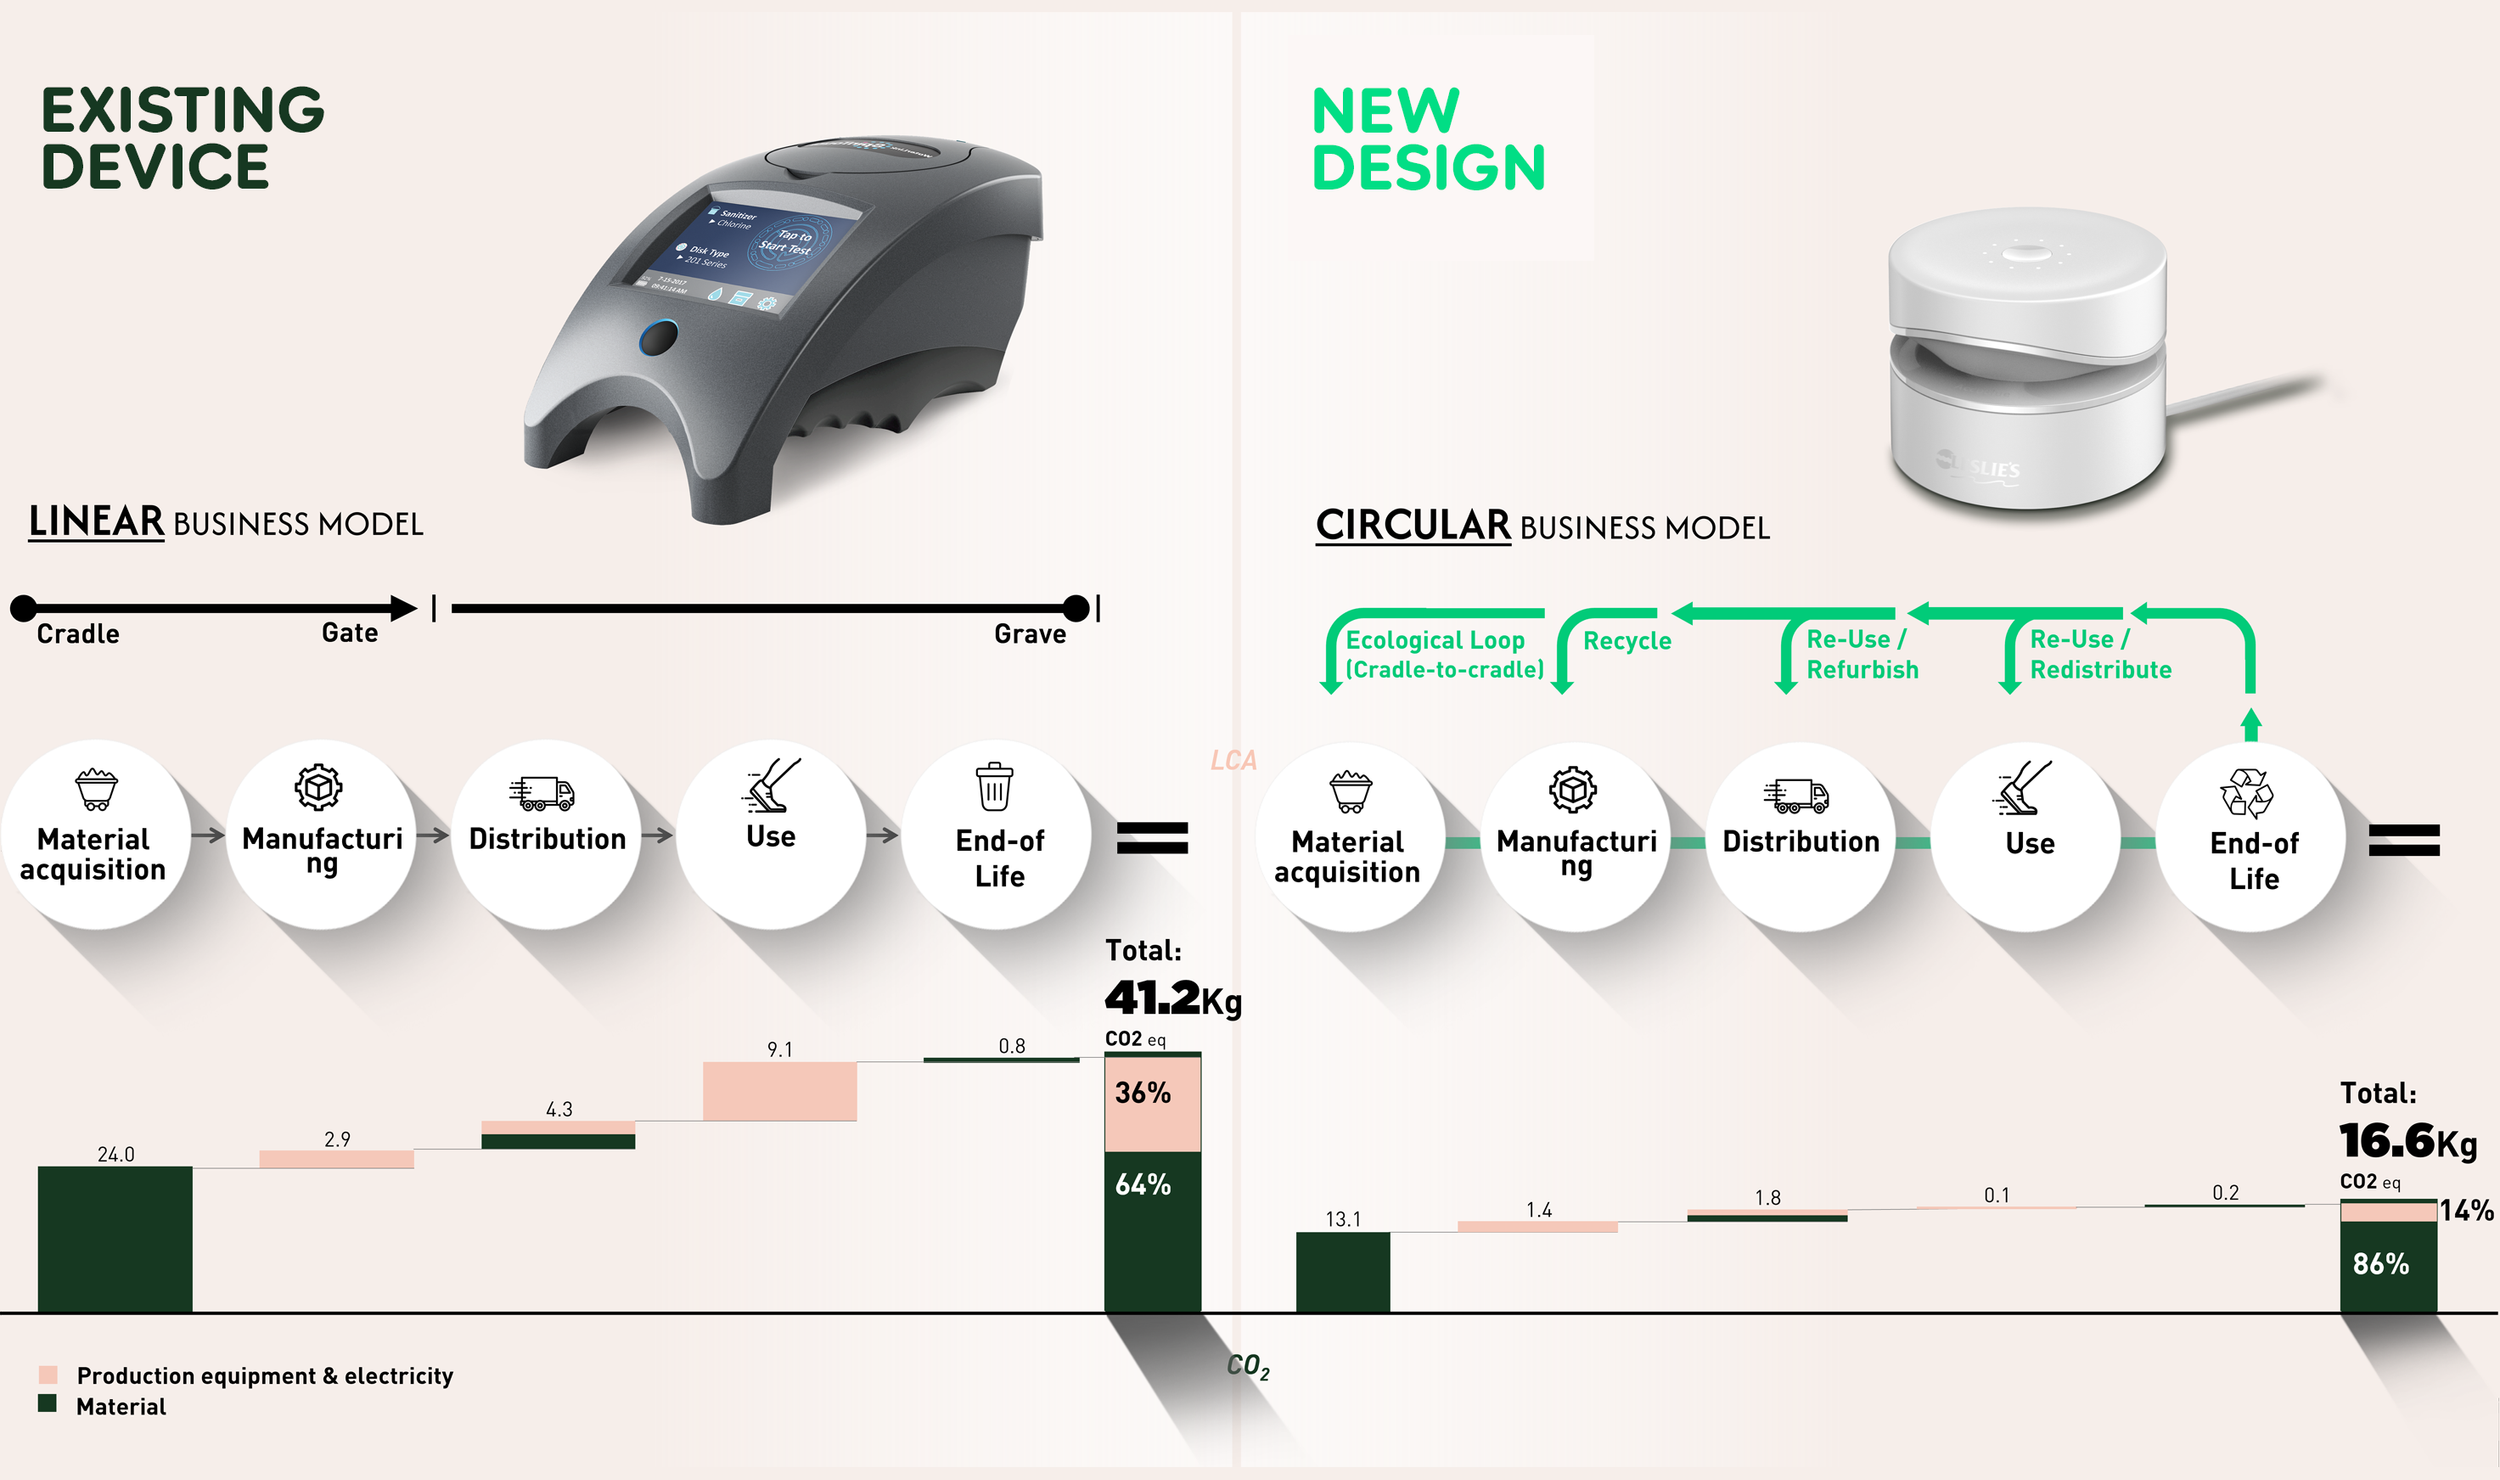
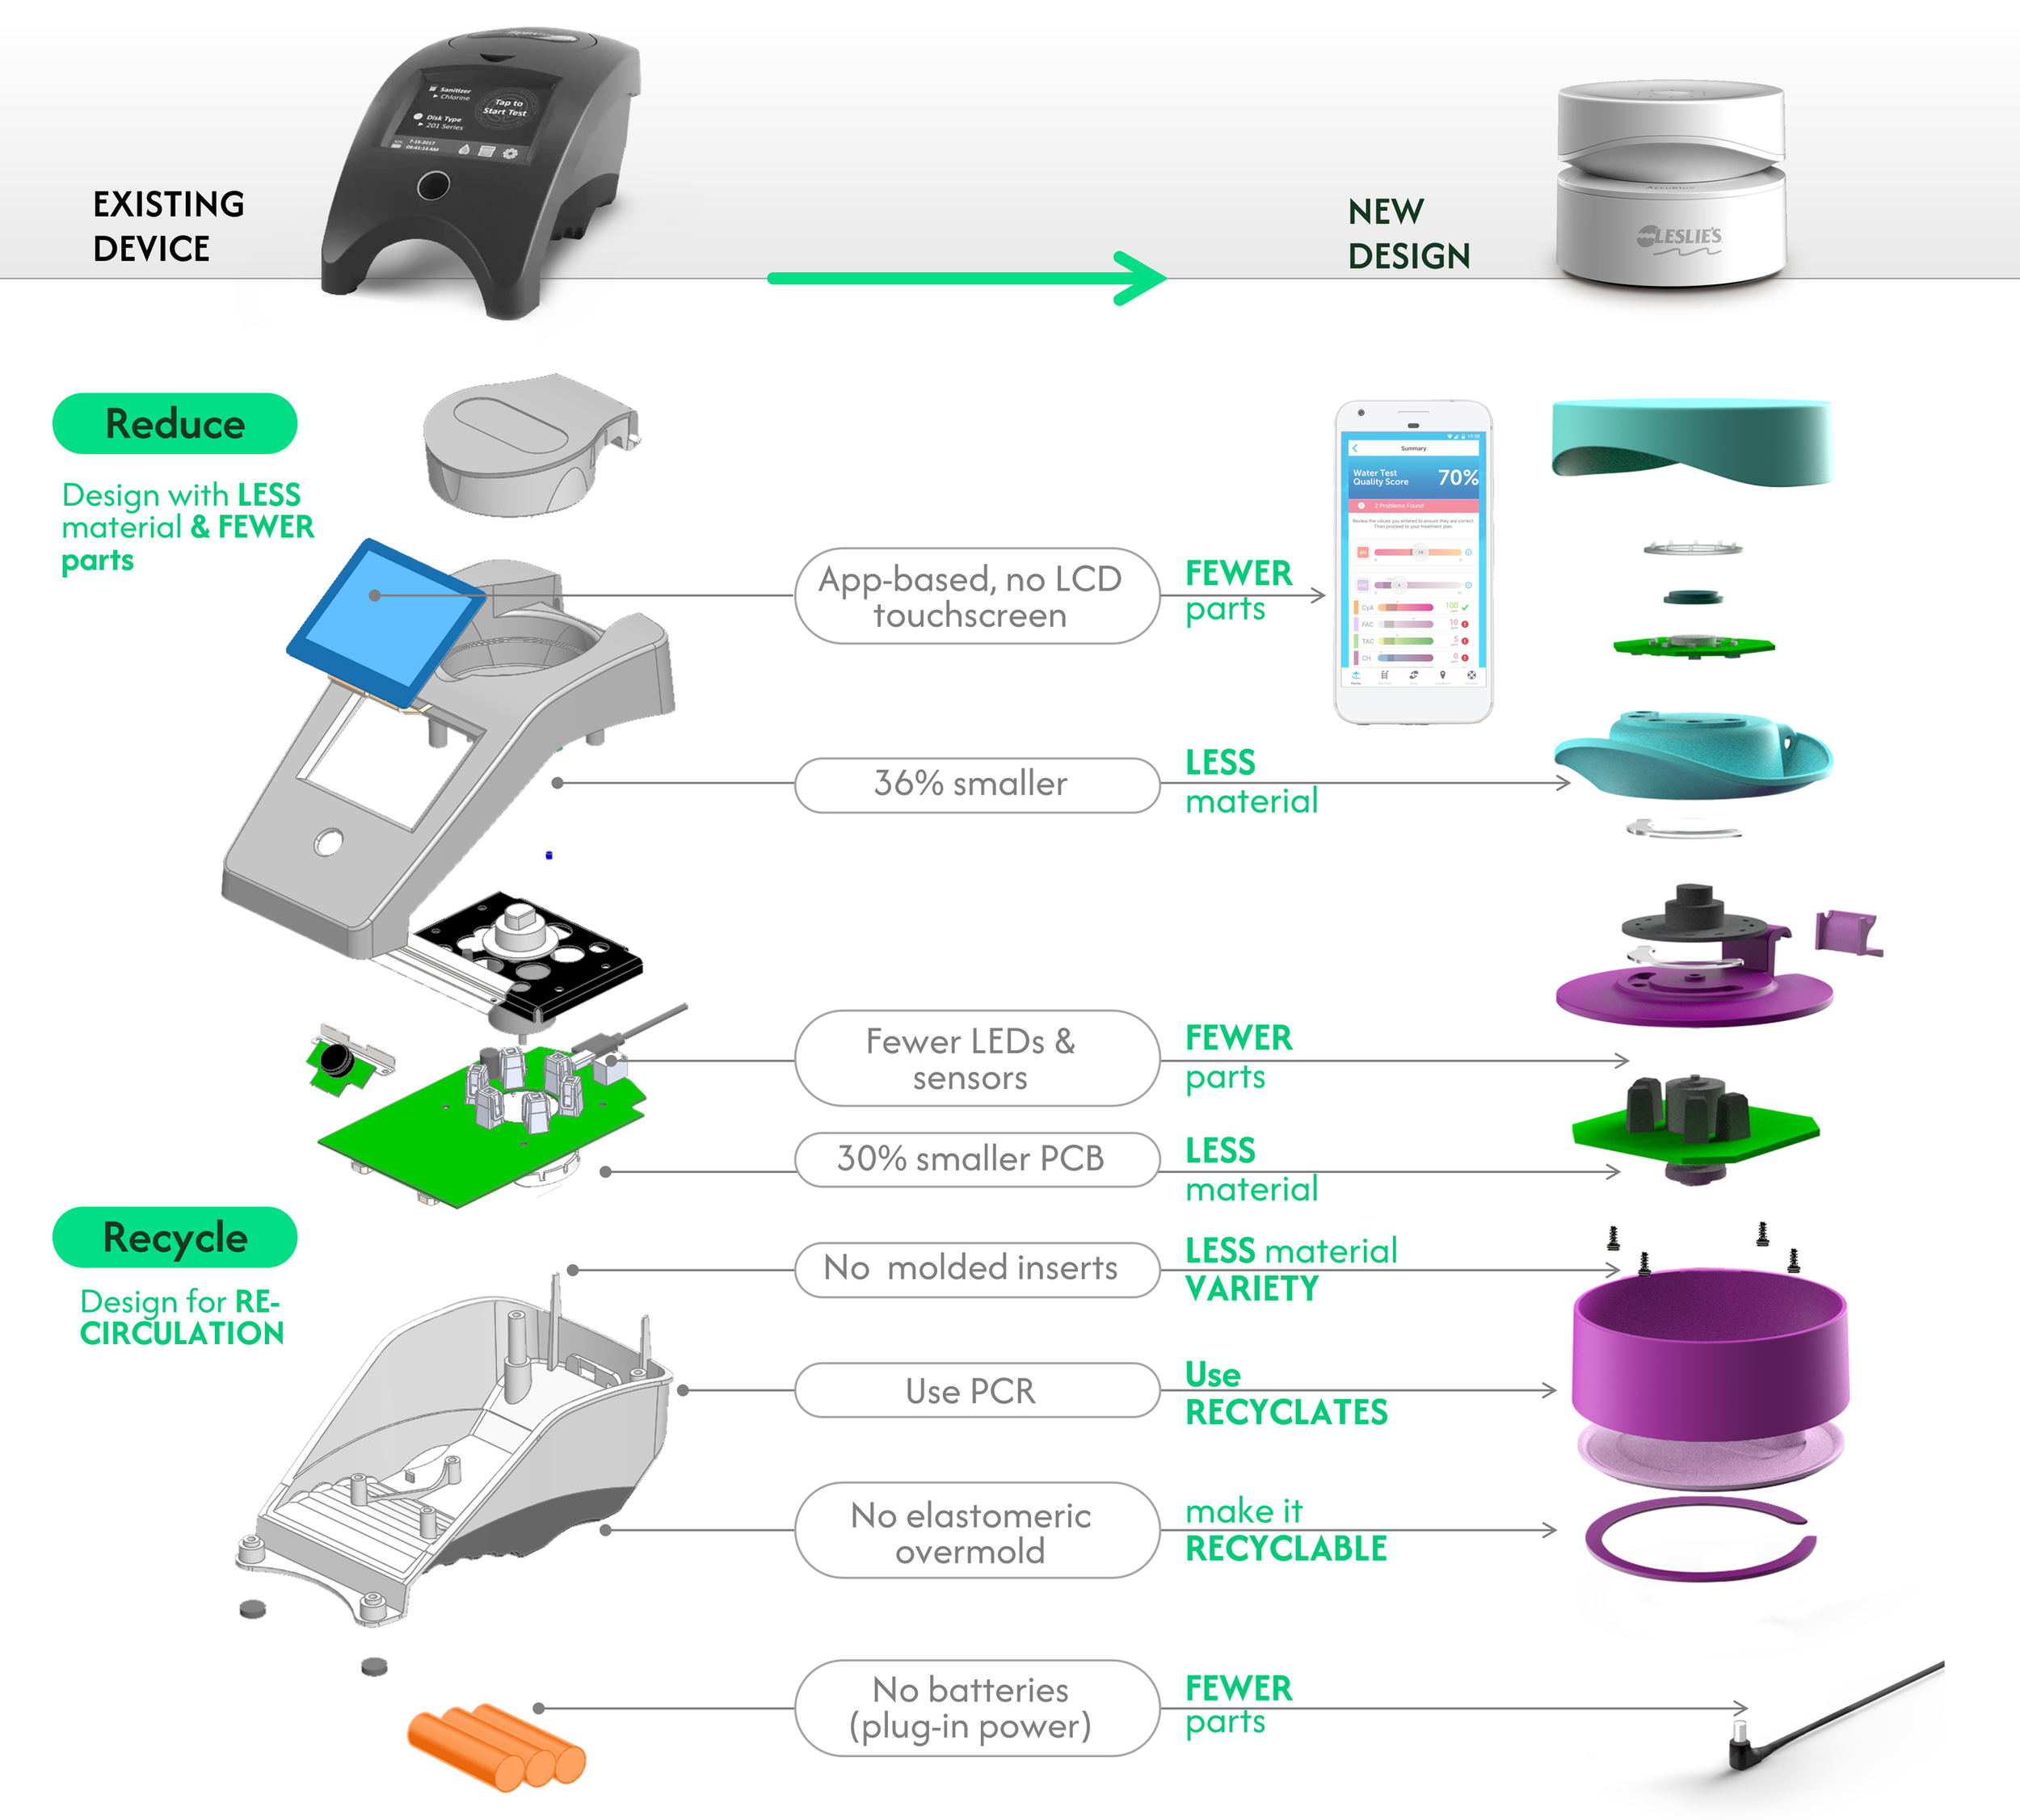
A smaller, app-based redesign reduces material use, components, and e-waste—making the product more sustainable and efficient
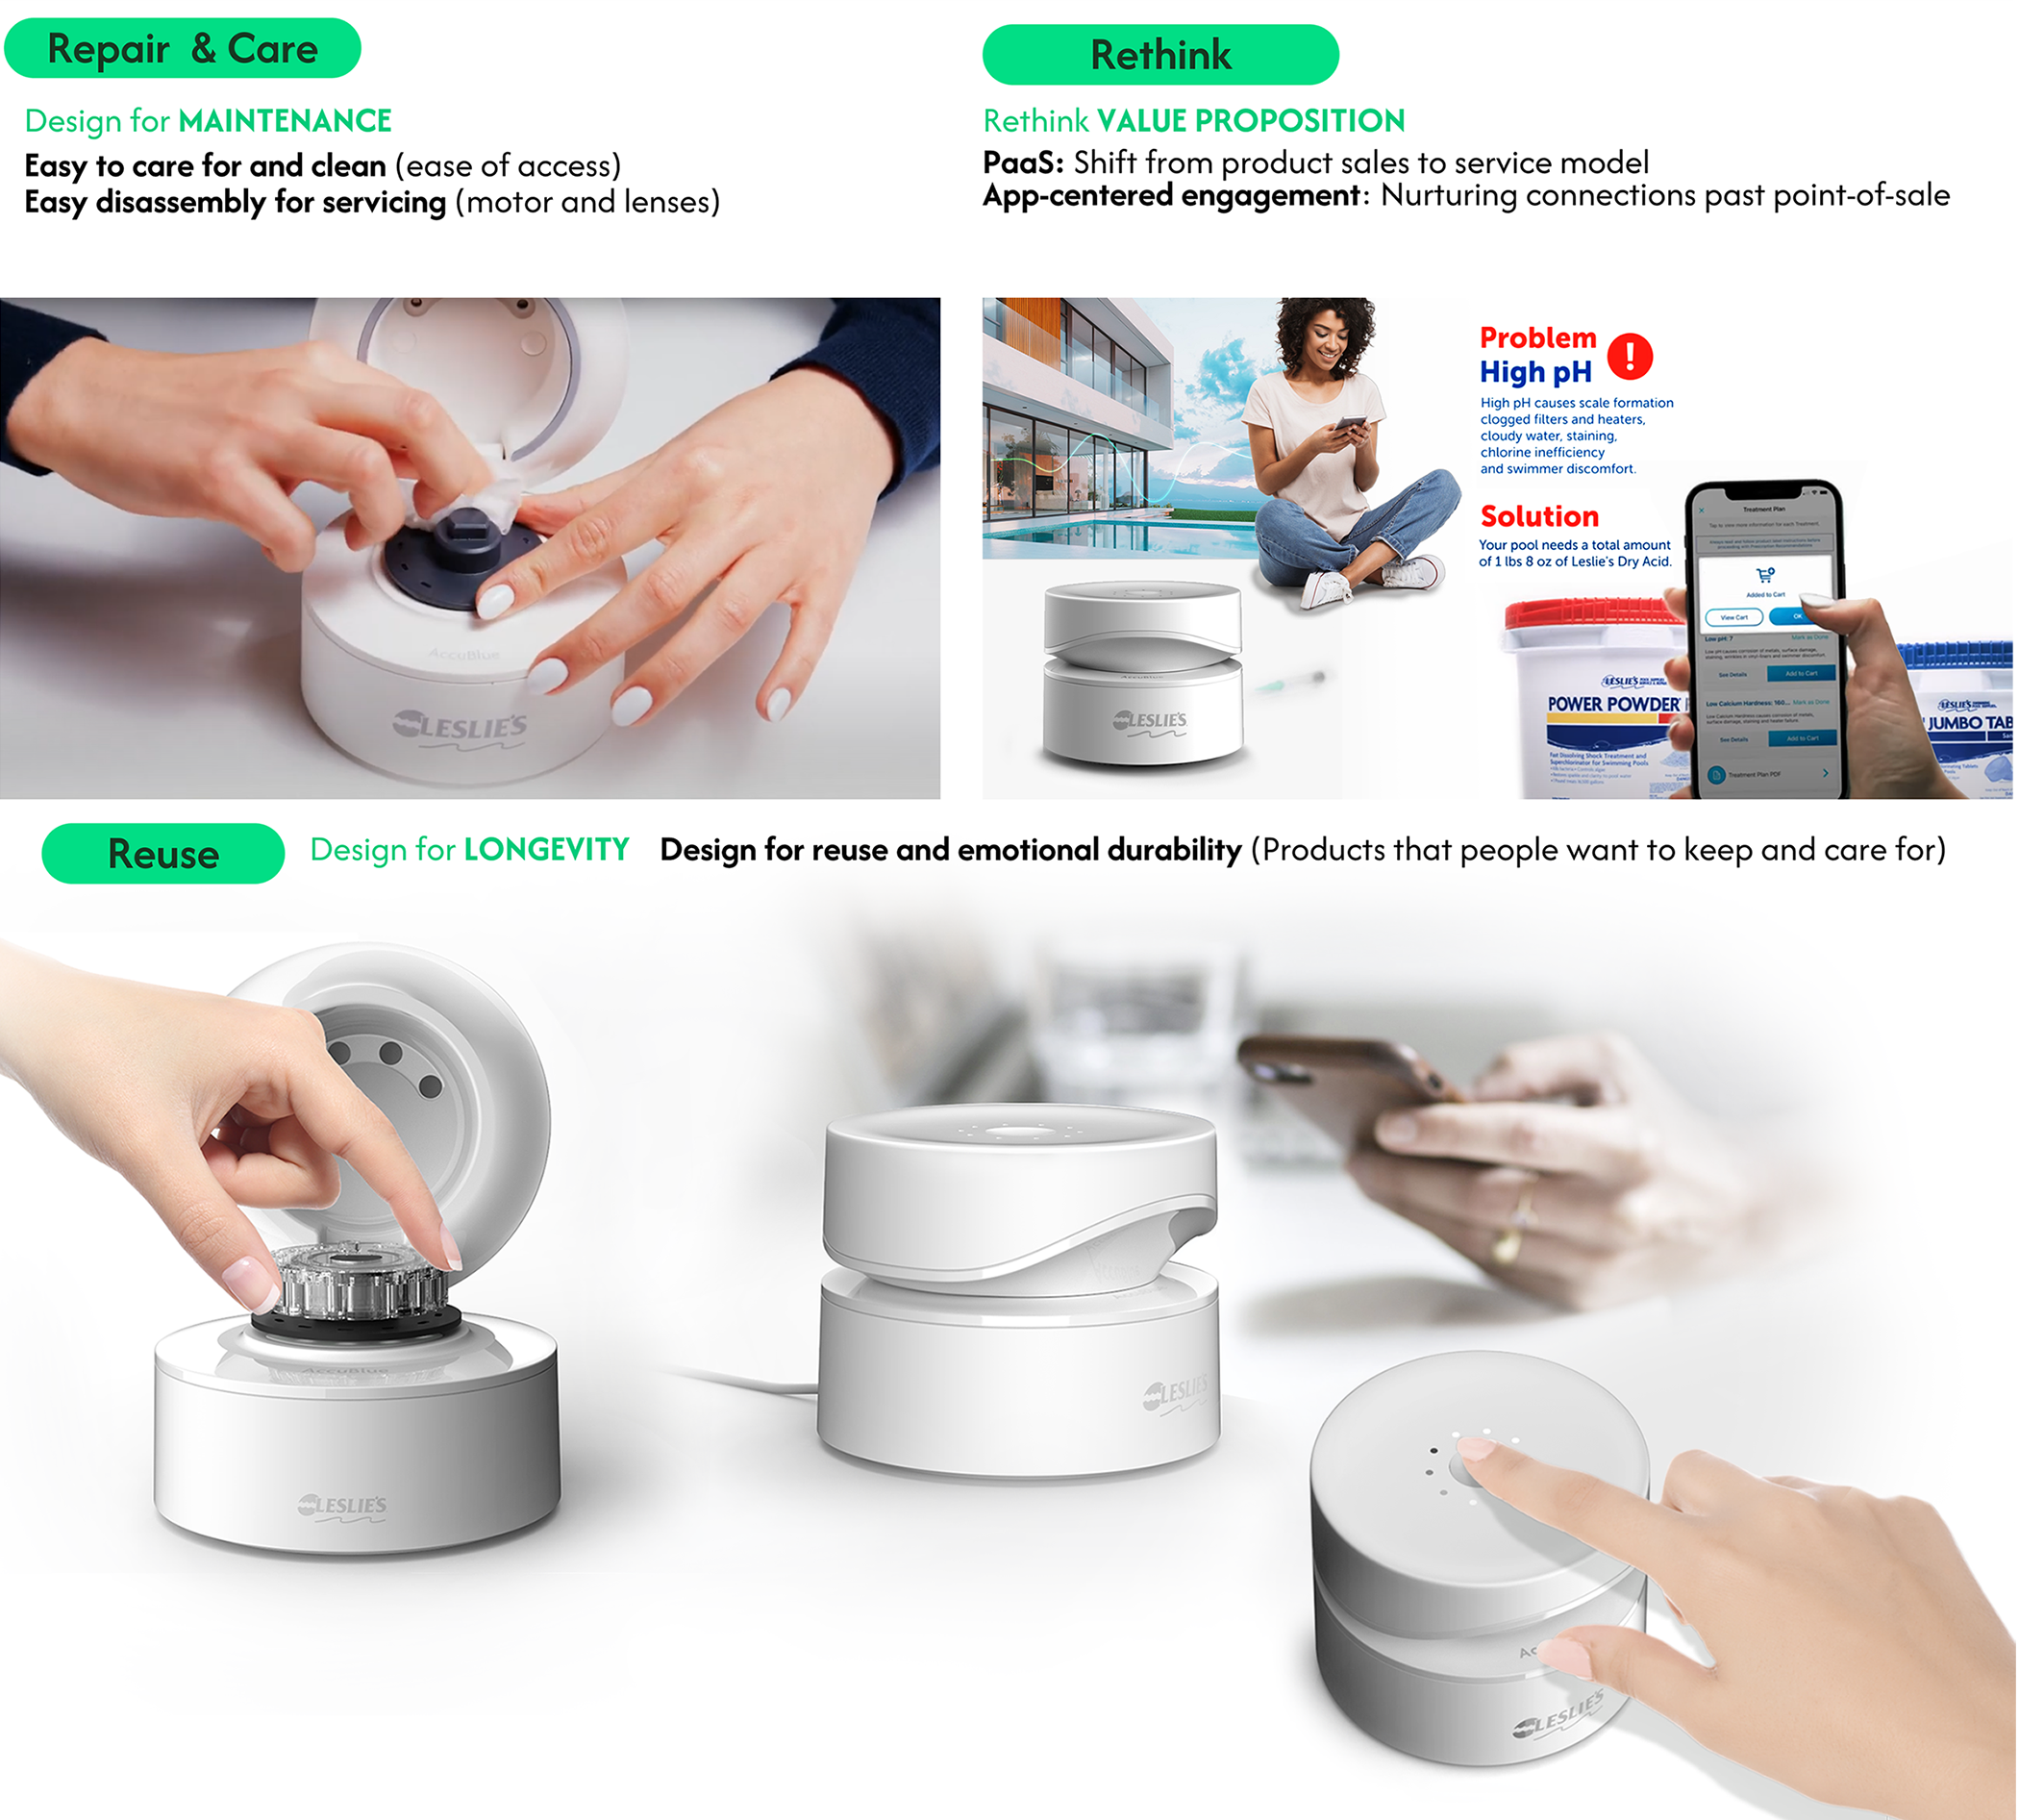
Easy to clean, service, and reuse. Built for subscription, making it intuitive and enjoyable to use
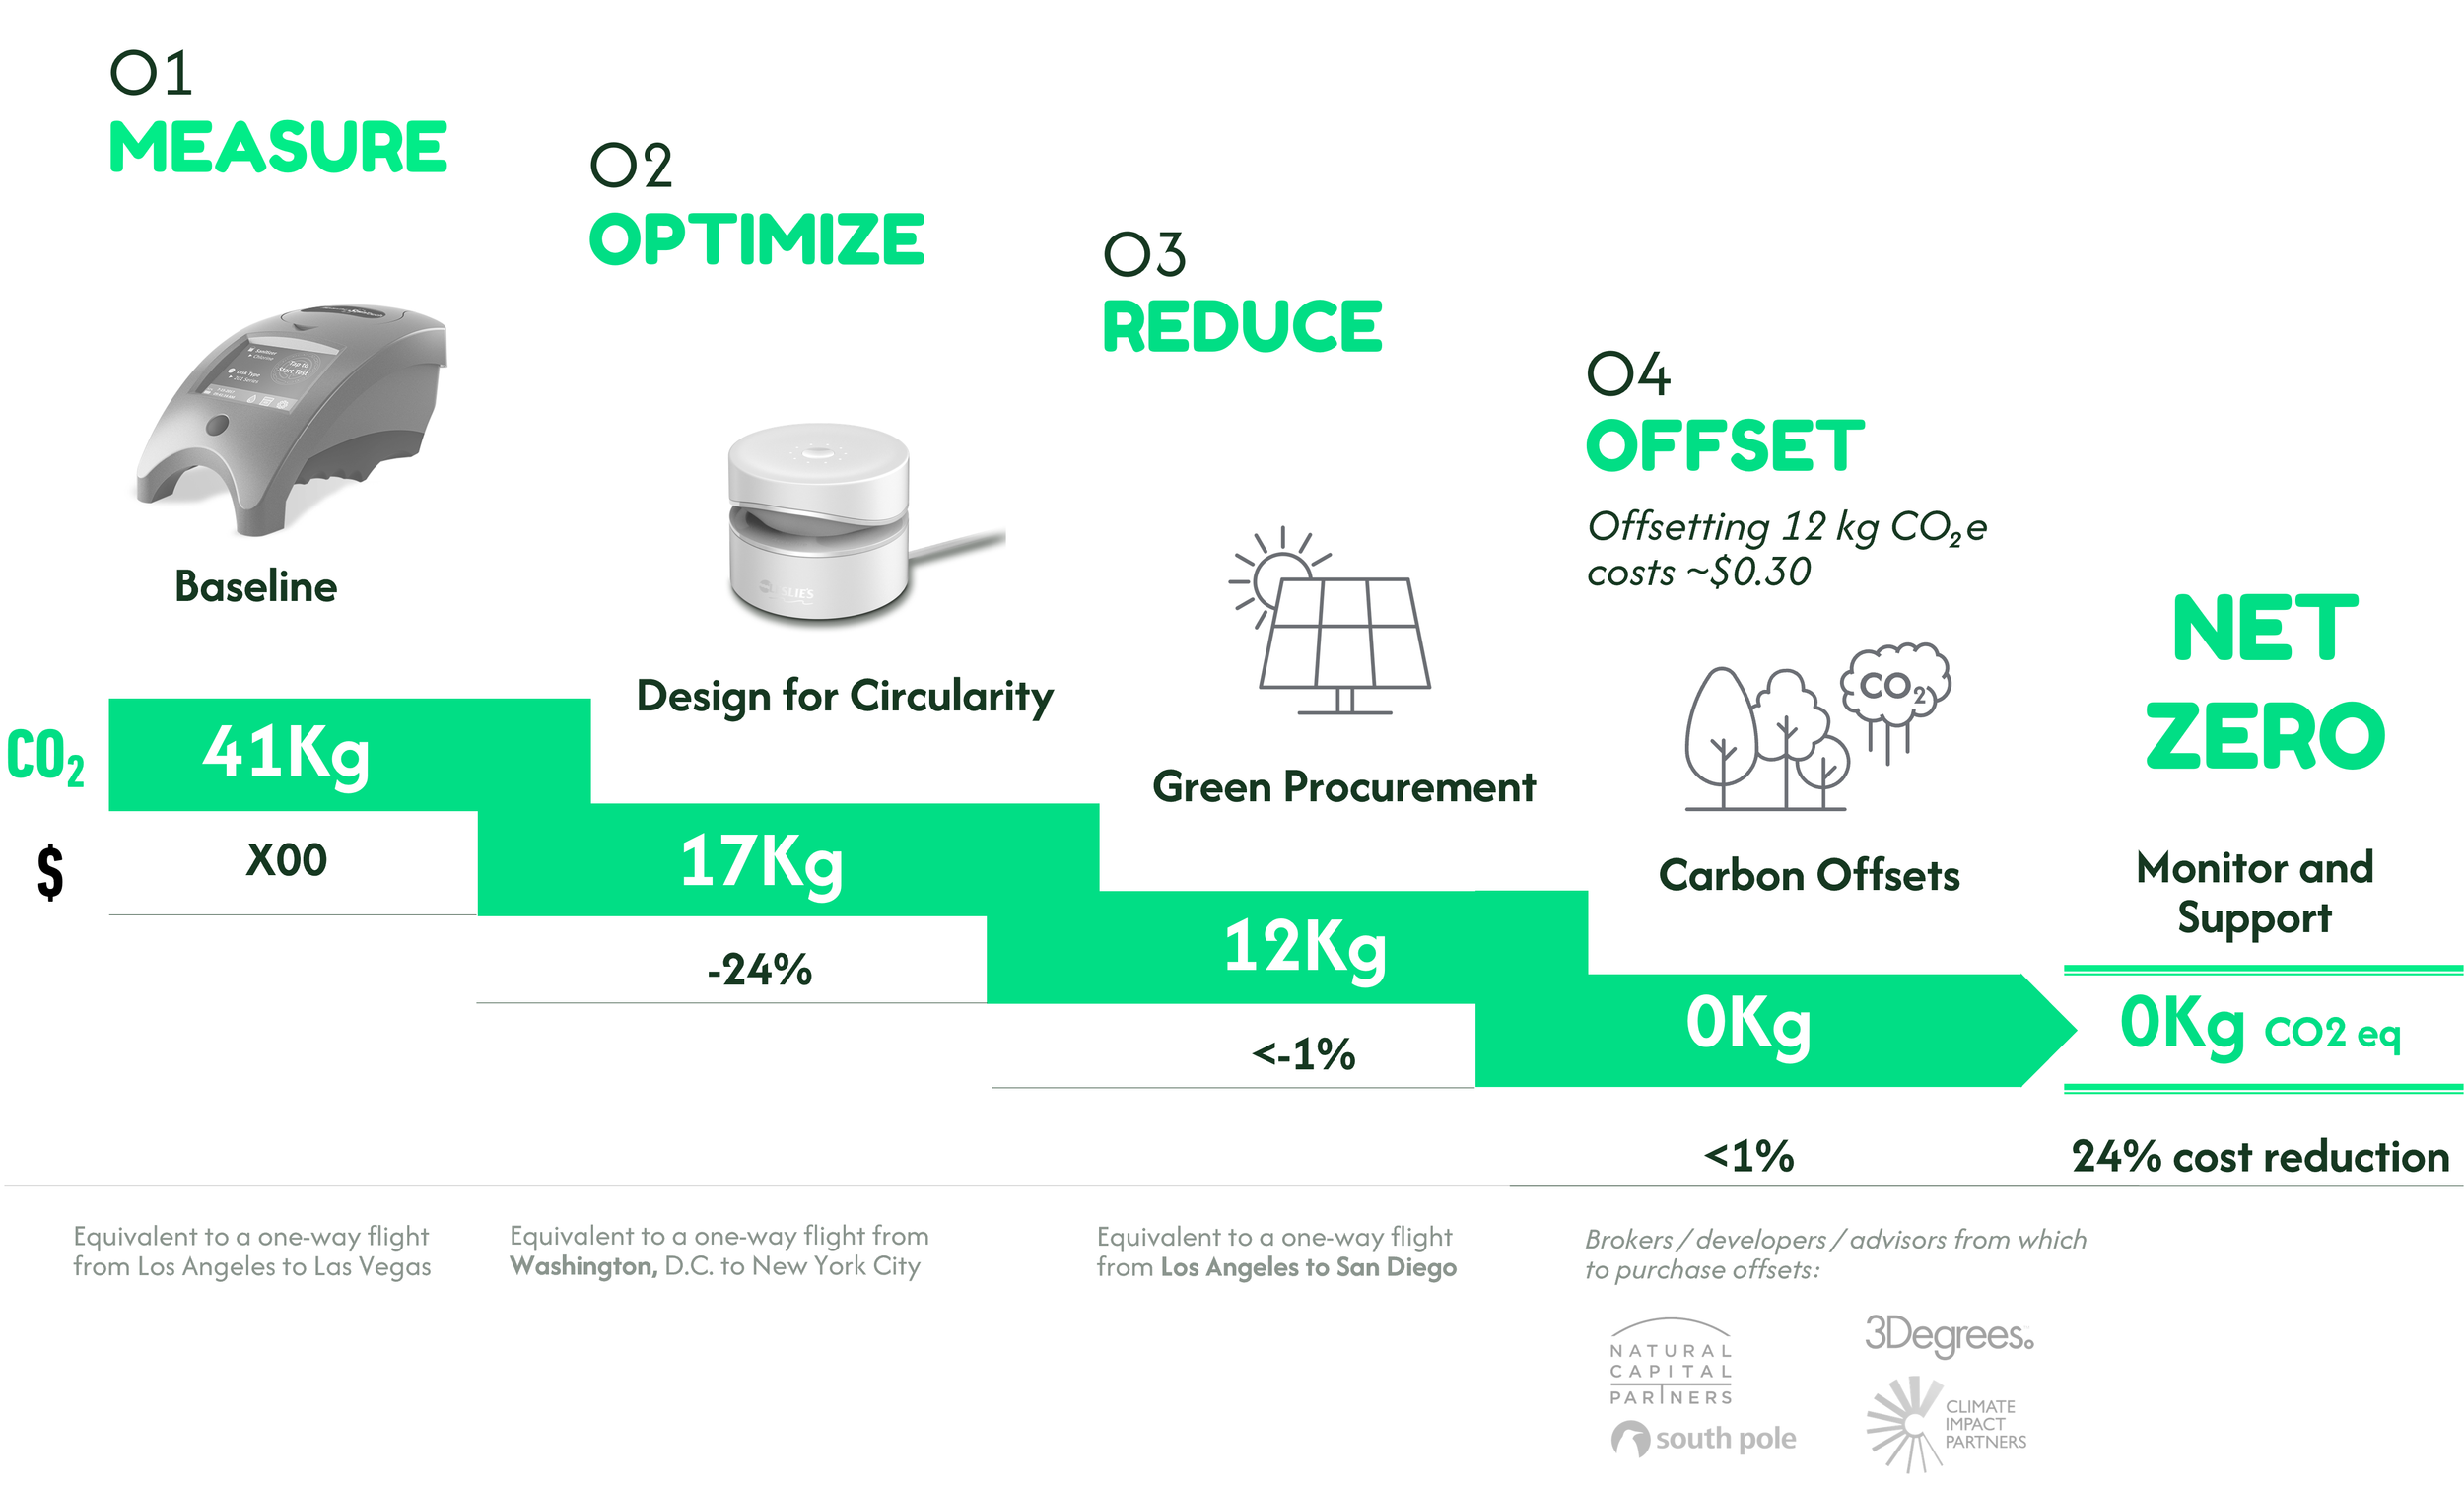
REDUCE
to achieve Net Zero beyond circular design strategies
Tracking each initiative’s cost and CO₂ impact revealed ways to offset higher decarbonization costs through savings from material reductions, renewable energy, and nearshoring. Despite the slight cost increase of sourcing 80% PCR ABS, these strategies lowered emissions and remained cost-effective.
03
OFFSET
remaining carbon emissions to achieve Net Zero
After applying all circularity levers, 12 kg CO₂e remained—a final hurdle to Net Zero. As a last resort, carbon offsets were evaluated, comparing carbon capture vs. tree planting. Though cost-effective, tree planting’s impact is uncertain due to slow carbon sequestration.
04
⚠️
Carbon offsets should be a secondary tool for Net Zero, as reforestation faces challenges with tree survival and carbon permanence, while carbon capture remains costly and unproven—making direct emissions reductions the priority.
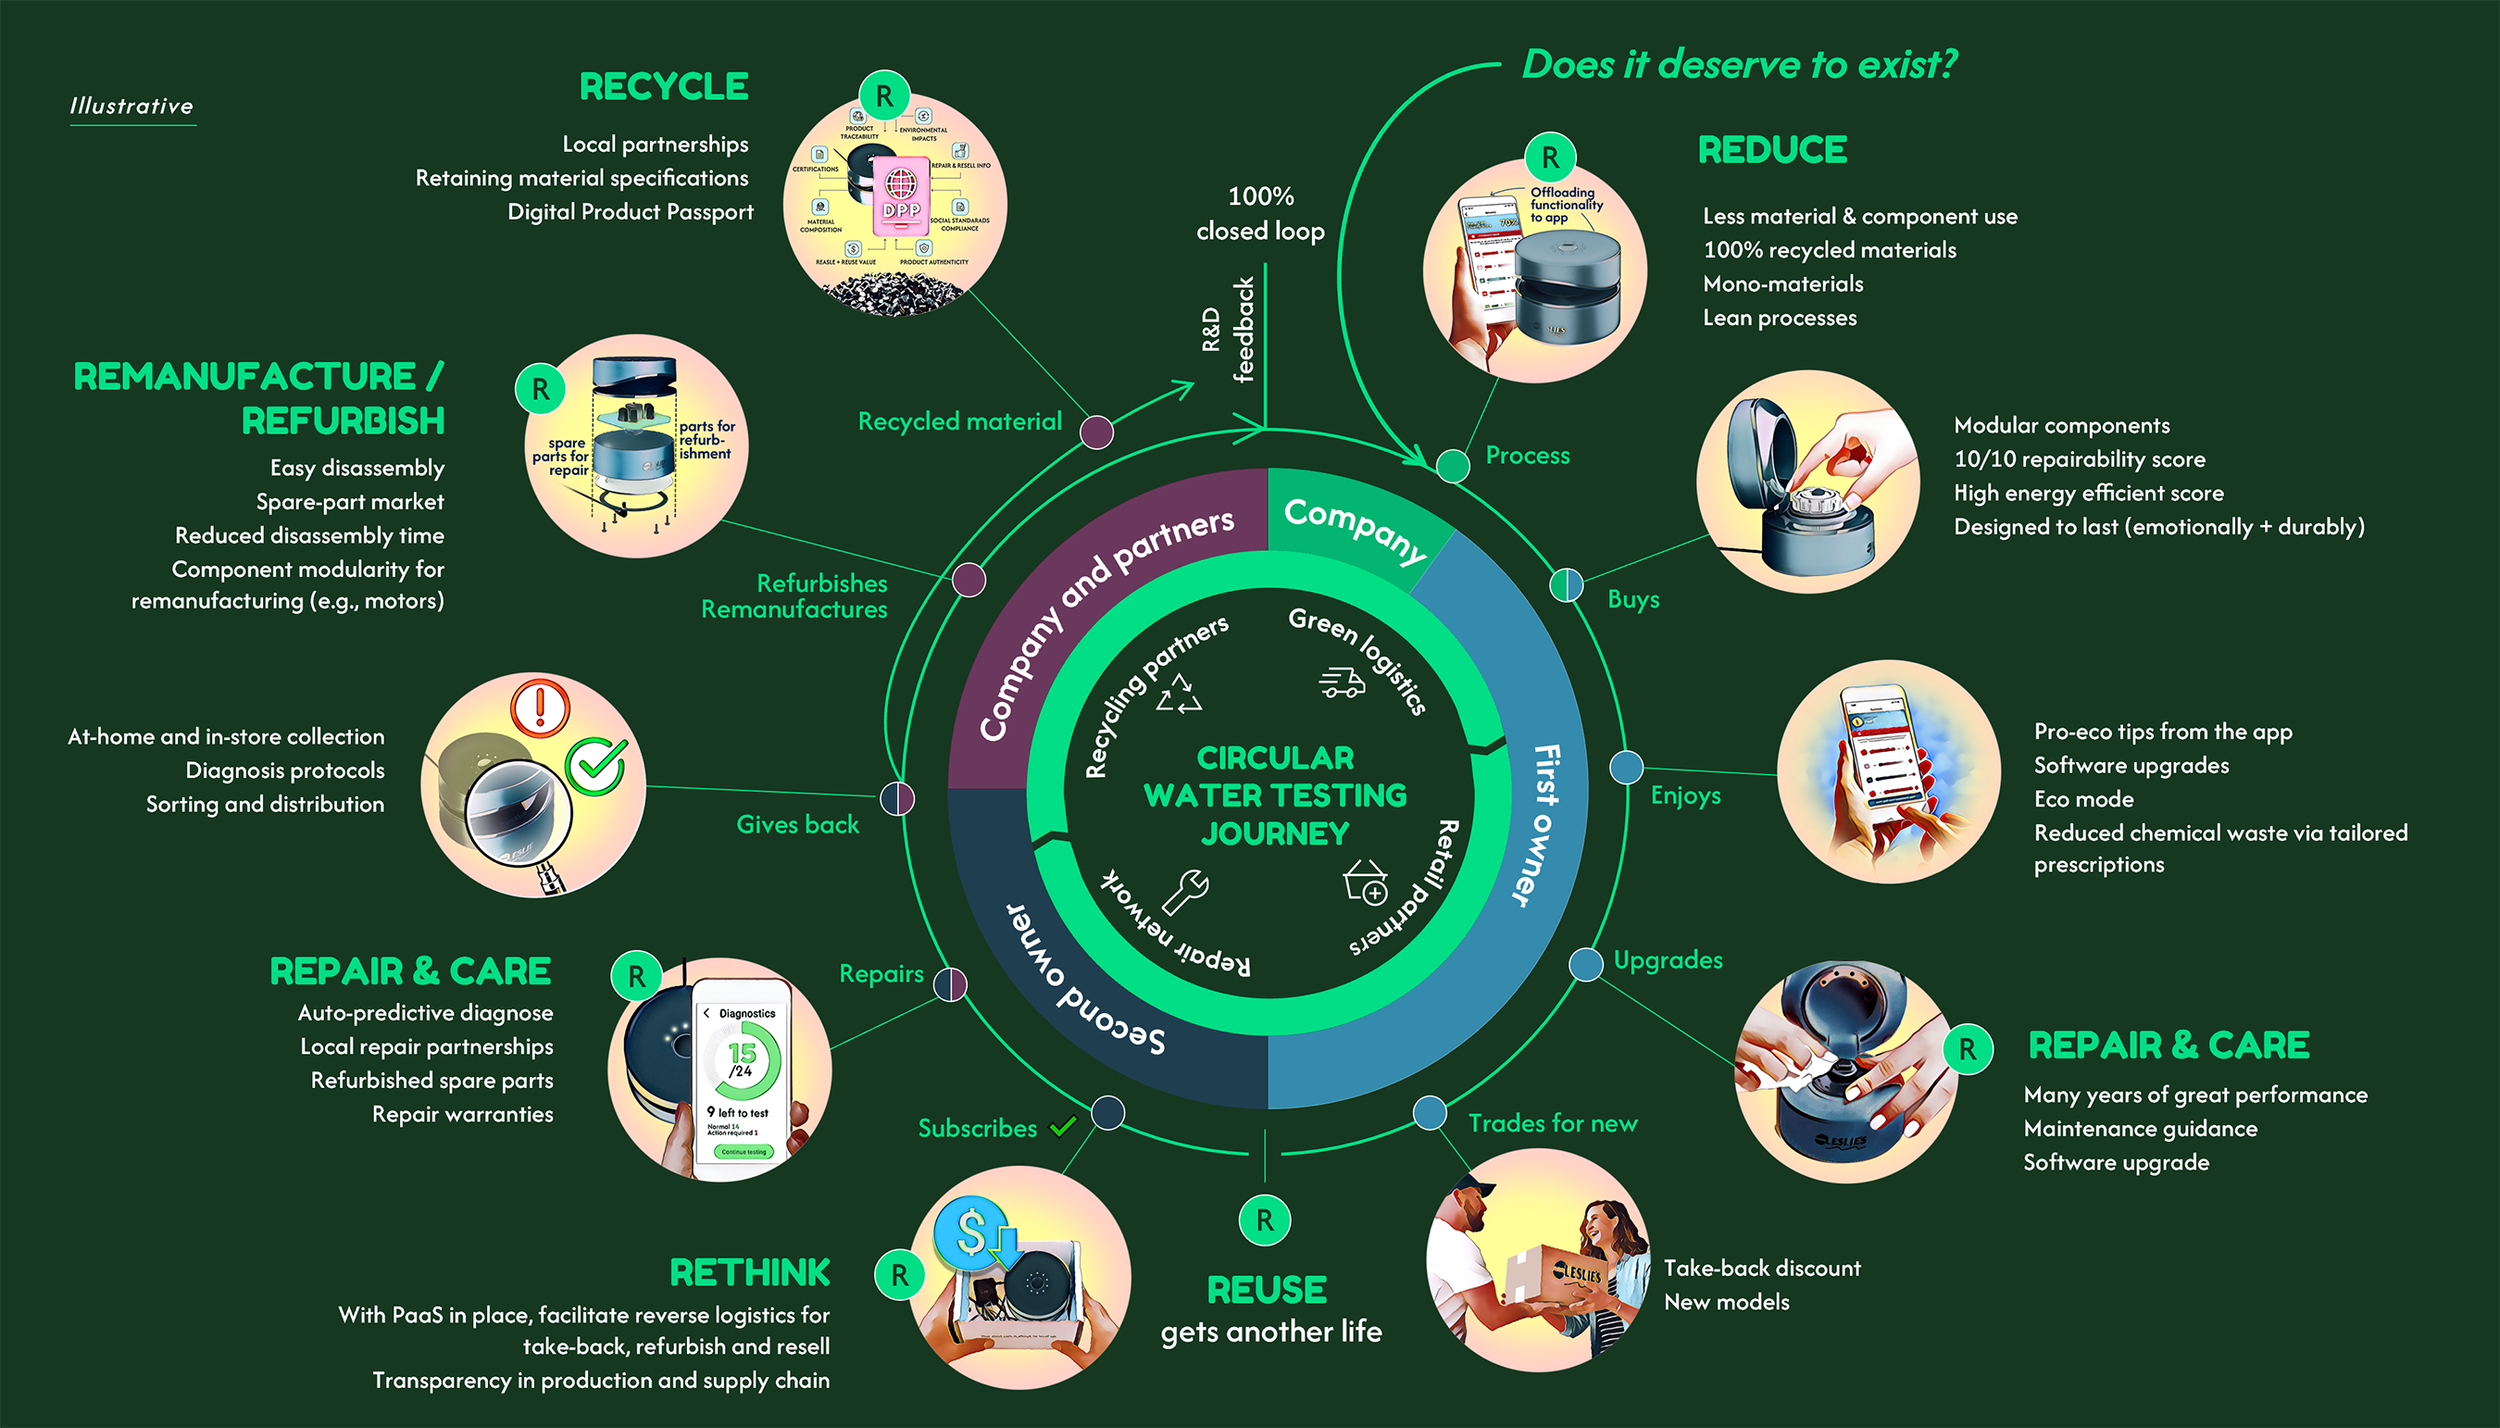
Mapping circularity: From product to ecosystem
To understand circularity as a network, we must map the entire ecosystem. Success depends on an interconnected system where companies, partners, and consumers collaborate at every stage to close the loop.
Inspired to design for circularity? Let's connect and make it happen!
In 2022, I led an 8-week analysis with analysts, designers, and engineers to assess life cycle impacts, costs, and carbon reduction, developing a net-zero strategy and codifying key processes for future use.
TEAM
Program Leadership
Lea Kobeli
LCA and Should Costing Lead
Abhay Chandora
Analysts
Jonathan Miao, Ronald Miller
Mechanical Engineering & DFM
Michael Boren, Alex Dakin
Business Development
Jedd Martin
CREDITS
Designed by McKinsey Design
Media Credits McKinsey Design, Leslie’s, LaMotte
This project is presented for portfolio purposes only and is not affiliated with or endorsed by any company. All rights reserved.
Back to Overview
Next: Plastic reduction